Phase
changes
|
Clausius-Clapeyron equation
|
We have seen that when a liquid reaches the equilibrium with its vapor, the
pressure exerted by vapor is constant (at constant temperature). This pressure
is known as vapor pressure and it depends only on temperature.
The concept of vapor pressure is not limited to liquids, also solids
reaches an equilibrium with its vapor and also in this case the pressure
exerted by the vapor pressure is constant at constant temperature. Clausius-Clapeyron
equation (equ 1, derived later) describes the dependence of vapor
pressure on temperature for a system of one component distributed
between two phases (e.g., liquid-vapor, solid-liquid):
|
Equ 1
 dP dP l l
------ = ----------
 dT dT T
(Vf-Vi) T
(Vf-Vi)
|
where
P = vapor pressure
T = absolute temperature at which phase change takes place
l = the latent heat of the transformation
considered
Vf = the volume after the phase change
Vi = the volume before the phase change
|
Since l and T are always positive, it is evident
that the sign of the term dP/dT depends uniquely on Vf -
Vi. Generally Vf > Vi and
thus dP/dT > 0. Therefore,
an increase of P leads to an increase of phase change temperature
(and viceversa).
an increase of T leads to an increase of vapor pressure
(and viceversa).
In the case of the fusion of water, since the volume of water is less than
that of ice (Vf < Vi), the opposite occurs (e.g.,
an increase of P leads to a decreases of melting temperature). Finally let's
note that the term dP/dT is sometimes called pressure
coefficient, its inverse (dT/dP) is called temperature coefficient.
Integration
of C-C equation
|
Sublimation and evaporation. The integration of the C-C
equation, in the case of sublimation and evaporation, can be simplified by assuming
that vapor behaves as an ideal gas, Vi (volume of the solid
or volume of the liquid) is negligible when compared to Vf (volume
of vapor) and l does not depends
on temperature. On these assumptions, remembering that V = P/RT,
we have
 dP dP l l lP lP
------ = -------- = ------
 dT dT T
(Vf) T
(Vf) RT2 RT2 |
 P2 P2 l(T2-T1) l(T2-T1) P2 P2
ln ---- = ------------- = 2.3 log ---
 P1 P1 RT1T2 RT1T2 P1 P1 |
To take in account of the dependence of l from temperature,
the mean value of latent heat, at T1 and at T2, should
be used.
Sometimes during sublimation a thermal dissociation can take place thus, indicating
with n the total moles of vapor:
 P2
P2 l(T2-T1)
2.3 log ---- = -------------
 P1
P1 n
RT1T2
Indefinite integration. The indefinite integration of C-C equation
also gives an useful expression for the solution of practical problems. By rearranging
and integrating, the equation previously obtained, we get
 dP dP lP lP
------ = --------
 dT dT RT2 RT2 |
 dP dP ldT ldT
----- = -----
 P P RT2 RT2 |
 l l
ln P = - ---- + cost
 RT RT |
By using decimal logarithms
 l l
2.3 log P = - ---- + cost
 RT RT |
 l l
log P = - ------ + cost
 2.3 RT 2.3 RT |
The last equation is the equation of a straight line with slope - l
/ 2.3 R, thus from the plot of Log P vs. 1/T, we can graphically determine
the slope and then calculate l.
This equation can be applied to evaporation anf sublimation processes, just
changing the value of latent heat.
It has been observed that for most liquids with molecular weight near 100,
the entropy of evaporation (i.e., the term l /T)
is near the same, i.e., DS = lev/
Te @ 21 cal/oK
mole@ 85 J/oK mole where Te
is the temperature of ebullition (oK) at 1 atm. Therefore,
for an evaporation process taking places at 1 atm, the equation obtained
by indefinite integration of C-C can be simplified as follows
 l
l -
21
-
21
log 1 = - ------ + cost = ------- = 0
 2.3 RT
 2.3
R
2.3
R
by using for R the value 1.98 cal/mole K we have - 4.61 + const = 0 and
thus const = 4.61.
The constant can be substituted in the original equation to get
 l
l l
l
log P = - ---------------- + 4.61 = - -------- + 4.61
 (2.3) (1.98)
T
 4.576 T
By plotting log P versus 1/T we obtain a straight line with a negative
slope (- l / 4.576) and thus
l = (slope) (4.576)
Let's apply the formula derived above to two different compounds which are
at two differents temperatures:
Now consider that liquid A at temperature Ta has the
same vapor pressure of liquid B at temperature Tb,
i.e., Pa = Pb. In these conditions it should be
 -
lA -
lA -
lB -
lB
----------- + 4.61 = ---------- + 4.61
 4.576 TA 4.576 TA 4.576
TB 4.576
TB |
 -
lA -
lA -
lB -
lB
 ------- = -------- ------- = --------
 TA TA TB TB |
From which
 TA
TA lA
lA
 ---= ----- = k
 TB
TB lB
lB
Now, if the two liquids has the same vapor pressure at other two differents
temperatures and assuming no change of l with
temperature, we have that
TA1 lA lA TA TA lA lA
--- = ----- = --- = ----- = k
TB1 lB lB TB TB lB lB |
 TA1 TA1 TA TA
 --- = ----
= k --- = ----
= k
 TB1 TB1 TB TB |
The last equation represents the rule of Ramsay and Young which states that,
at any external pressure, the ratio between the boiling points of two similar
liquids is constant.
The equation above, can be transformed as follows
 TA1 TA1 TA TA
 --- = ----- --- = -----
 TB1 TB1 TB TB |
 TA1 TA1 TB1 TB1
 --- =
---- --- =
----
 TA TA TB TB |
 TA1 TA1 TB1 TB1
 --- - 1
= ---- - 1 --- - 1
= ---- - 1
 TA TA TB TB |
 TA1
- TA TA1
- TA TB1
- TB TB1
- TB
 --------- =
---------- --------- =
----------
 TA TA TB TB |
 TA1 - TA
 TA
TA
 ---------= ----
= k
 TB1 - TB
 TB
TB
The last equation represents the rule of Duhring which states that for
similar liquids, a variation of the external pressure leads to the same variation
of the boiling points. This rule is, evidently, just a different statement
of the rule of Ramsay and Young.
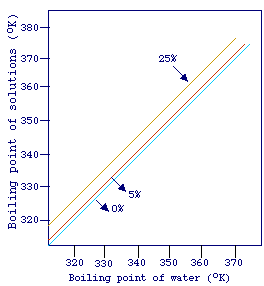
 The equation above can be furter rearranged to give TA = kTB.
It should be evident that a plot of TA versus TB will
yield a straight line. The picture shows a plot of the temperature of ebullition
of water, at different pressures, versus the temperature of ebullition of differents
sodium chloride solutions. The lines in this plot are generally referred to
as Duhring lines (in this case, for sodium chloride system) and can be
used for the estimation of the boiling point of complex mixtures such as liquid
foods. This is based on the assumption that some liquid foods exert a vapor
pressure similar to that of sodium chloride solutions.
Example. A liquid food is concentrated from 5 to 25% of solids at 20
kPa, extimate the boiling point elevation.
From steam table, the boiling point of water at 20 kPa is 333 K. From
the graph, we can see that at the same pressure, a 5% sodium chloride also boils
at 333 K. While a 25% sodium chloride solution boils at 337 K. If the assumption
made above holds these two temperature are also the temperature of ebbulition
of the liquid food at the two different concentrations, thus boiling point elevation
= 337 - 333 = 4 K
|
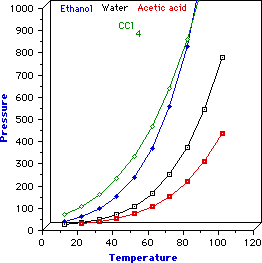
In fig 1 is reported the variation of the vapor pressure with the temperature
for three different liquids (the dependence P-T is approximatively described
by Clausius-Clapeyron equation). As it can be observed, the increase of
P is not linearly correlated to T. At low temperature P (vapor pressure)
is relatively insensitive to the temperature. Each point on the curve
represents the simultaneous values of temperature and pressure at which
liquid and vapor are at equilibrium. In other words, the plot represents
the variation of the boiling temperature with pressure. Points on the
left of a curve represent the simultaneous values of temperature and
pressure at which only the liquid exists. Points on the
right of a curve represent the simultaneous values of temperature
and pressure at which only the vapor exists.
Consider the curves relative to water and acetic acid, water boils at
a lower temperature than acetic acid and as can be observed, the vapor
pressure of water is always (at all temperatures) higher than that of
acetic acid. This is generally true, but some exceptions exist as is the
case of CCl4 and ethanol whose corresponding curves cross each
other.
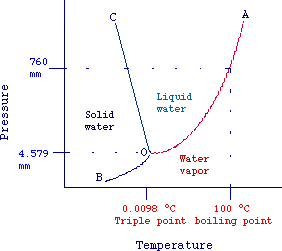
In fig. 2 (not drawn to scale) is reported the temperatutre dependence
of vapor pressure of water and ice (known as phase diagram of water).
Each line represents the simultaneous values of pression and temperature
at which two phases are at equilibrium. The areas between curves represent
temperatures and pressures values at which only one phase can exist.
O-C: solid-liquid equilibrium
B-O: solid-vapor equilibrium
O-A: liquid-vapor equilibrium
It should be evident that at intersection point (O) liquid, vapor
and solid are simultaneously at equilibrium. This point is known as triple
point (0,0098 oC and 4.759 mm Hg, for water). It
should be also noted that, as the pressure increases the melting temperature
of ice decreases (see Clausius-Clapeyron equation).
As an example consider water at 50° C and 1 atm (760 mm Hg), from
the plot we can see that the corresponding point lies in the area between
the lines OC and OA and thus water is in the liquid state.
If temperature is increased to 100°C, we have a point lying on the
curve OA and liquid water is in equilibrium with steam. In these conditions
water starts to boil.
Eventually, let's note that the vapor pressure of ice (line O-C)
is much less than atmospheric pressure. Considering water at 1 atm and
0°C, we can see from the graph, that by increasing the temperature
we reach first the liquid state (fusion) and then the vapor state (evaporation).
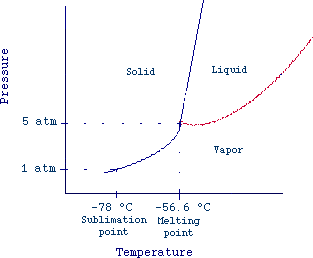
The fact that the vapor pressure of the solide state is less than 1 atm
is true for most compounds. However, some compounds such as iodine
and carbon dioxide have solid vapor pressure of 1 atm at temperature
lower than their triple point. Fig 3 reports the phase diagram of carbon
dioxide. If we consider CO2 at 1 atm and -78 °C, we can
see from the graph that increasing the temperature we reach the vapor
state without melting (sublimation).
|
Fig. 1

Fig. 2

Fig. 3

|
![]() dP
dP![]() l
l
![]() dT
dT![]() T
(Vf-Vi)
T
(Vf-Vi) The equation above can be furter rearranged to give TA = kTB.
It should be evident that a plot of TA versus TB will
yield a straight line. The picture shows a plot of the temperature of ebullition
of water, at different pressures, versus the temperature of ebullition of differents
sodium chloride solutions. The lines in this plot are generally referred to
as Duhring lines (in this case, for sodium chloride system) and can be
used for the estimation of the boiling point of complex mixtures such as liquid
foods. This is based on the assumption that some liquid foods exert a vapor
pressure similar to that of sodium chloride solutions.


