|
Introduction
|
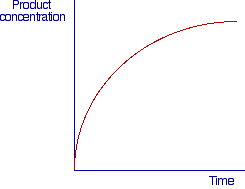
We have already illustrated, in chemical kinetics, the concept of initial rate of a reaction. This concept also applies to the study of reactions catalyzed by enzymes. In the picture below is reported a qualitative plot of the concentration of a product of a reaction vs time.

In such plot the velocity of the reaction is given by the slope of the curve (dP/dt) in the point considered and as it can be observed the velocity decreases as the reaction proceeds. This can be due to various factors:
1) If the reaction is reversible the rate we measure is a net reaction rate, i.e.
net reaction rate = forward rate - reverse rate
As the concentration of product increases the reverse rate increases and the net reaction rate decreases.
2) If the concentration of reagents (commonly known as substrates) is low, their concentration will appreciabily decreases during the course of the reaction and this will result into a lower reaction rate.
3) The enzyme may be unstable under the experimental conditions used.
4) The products of the reaction may inbith the enzyme.
It follows that for a correct study of enzyme kinetics we need to measure the initial rate of the reaction, i.e., the rate should be measured before the effects of the factors illustrated above become appreciable.
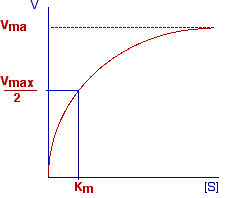
The plot reported below shows the variation of the initial rate of a simple enzymatic reaction with concentration of substrate.

This curve (an equilateral hyperbole) is described by the Michaelis-Menten equation:
![]() Vmax [S]
Vmax [S]
![]() V = ----------
V = ----------
![]() [S] + K
[S] + K
In this equation Vmax is a constant representing the maximum rate observable in the given experimental conditions. K is another constant known as the constant of Michaelis-Menten.
It is easy to demonstrate that K represents the concentration of substrate ([S]) at which V = 1/2 Vmax. In fact, by posing V = Vmax/2 in the M-M equation, we have that:
|
K = 2[S] - [S] = [S]
|
It should be pointed out that the M-M equation holds when:
the concentration of the enzyme is constant;the initial rate are measured;
the reaction involves one substrate or, for multisubstrates reactions, only the concentration of one substrate is changed.
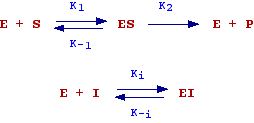
The hypothesis made by the authors to deduce the equation are summarized in the following scheme:

In words, there is first the reversible formation of a complex enzyme-substrate (ES) and then the transformation of ES into free enzyme and product. This last step is thought as the rate determining step (the slowest step). Therefore the initial rate of the reaction will be given by:
Vo = K2 [ES] (see chemical kinetics)
When [S] increases, [ES] and as consequence Vo will increases. Since we assume that the concentration of enzyme is constant there will be a value of [S] at which all the enzyme is bound to S (the enzyme is completely saturated) and Vo will be the maximum velocity observable (Vmax).
In order to deduce the M-M equation, let's find a relation expressing [ES] as function of [S], this can be accomplished by considering the velocity of formation and dissociation of the complex enzyme-substrate:
|
Formation ES (equ.2) V1 = K1 (Eo - [ES]) [S] |
Dissociation [ES] (equ.3) V-1 = K-1 [ES] |
In equation 2, Eo is the initial concentration of enzyme and of course at a given instant the concentration of enzyme determinig the velocity is Eo minus the amount of enzyme bound to the substrate (ES). On the other hand, the concentration of substrate can be considered constant in that the molar concentration of enzymes (high molecular weight) is negligible when compared to the molar concentration of substrates (generally having low molecular weights). At the equilibrium
V1 = V-1 and thus K1 (Eo - [ES]) [S] = K-1 [ES]
from which
![]() K-1
K-1![]() (Eo
- [ES]) [S]
(Eo
- [ES]) [S]![]() Eo
[S]
Eo
[S]![]() [ES] [S]
[ES] [S]![]() Eo
[S]
Eo
[S]
![]() --- = ---------------------
= -------- - ---------- = --------- - [S]
--- = ---------------------
= -------- - ---------- = --------- - [S]
![]() K1
K1![]() [ES]
[ES]![]() [ES]
[ES]![]() [ES]
[ES]![]() [ES]
[ES]
From the equation above, by posing K-1/K1 = Ks and remembering that Vo = K2 [ES] (see above), it will be:
Realizing that K2 Eo represents Vmax (Eo is the maximum amount of complex which can be formed) we obtain the M-M equation:
![]() Vmax [S]
Vmax [S]
![]() Vo =
-------------
Vo =
-------------
![]() Ks + [S]
Ks + [S]
 In
the steady-state hypotesis (Briggs-Haldane), it is assumed that during
the period of time Vo is measured, the rate at which the complex
is formed exactly matches the rates at which the complex disappears. In 1, 2
and 3 are reported the reactions leading to formation and decomposition of ES
as well as the expressions for the relative reaction rates.
|
Formation of ES (equ.1) E + S = ES V1 = k1 (Eo - [ES]) [S] |
Decomposition of ES (equ.2) ES = E + S V-1 = k-1 [ES] |
Decomposition of ES (equ.3) ES = E + P V2 = k2 [ES] |
Under steady-state conditions, the rate of appearance of ES must match the rate of decomposition of ES and equations 4a and 4b hold.
| 4a) k1(Eo - [ES])[S] = k-1[ES] + k2[ES] | 4b) k1Eo[S] - k1[ES][S] = k-1[ES] + k2[ES] |
By dividing equation 4b with k1[ES] we get:
| k1 Eo[S] - k1[ES]
[S] ---------------------- = ------------------- |
Eo[S] ----- - [S] = ----------- [ES] |
Eo[S] ------ = ----------- + [S] [ES] |
By indicating with Km the ratio between the kinetic constants, we have that
And assuming that Vo = K2[ES] (see above)
Thus, we have obtained here an equation formally identical to the one deduced with the equilibrium hypothesis. However the two equations differs for the meaning of K.
|
Ks = K-1/K1 |
Km = (k-1 + k2)/k1 |
In the equilibrium hypothesis the constant (Ks) represents the dissociation constant of the complex ES. Only when k2 >> k-1, Km will approximate to Ks.
In principle Km and Vmax could be determined by measuring the initial rate at differents concentrations of substrate until to reach Vmax. However, it can be difficult to reach the concentration of substrate completely saturating the enzyme (e.g. for solubility problems). The best way to accomplish the determination of Vmax and Km is the use of linearized form of the M-M equation.
![]() Lineweaver and
Burk plot (double reciprocal plot)
Lineweaver and
Burk plot (double reciprocal plot)
In this approach the M-M equation is rearranged as follows:
1a) Vo = ---------- |
1b) --- = ---------- = --------- + --------- |
1c) --- = ---- ---- + ---- |
Equation 1c represents the equation of a straight line with slope Km/Vmax:

As it can be observed, when
1/[S] = 0 the line will intercept the y axis at the value 1/Vmax.
1/Vo = 0 the line will intercept the x axis at the value -1/Km.
![]() Eadie and Hofstee
plot (single reciprocal plot)
Eadie and Hofstee
plot (single reciprocal plot)
The M-M equation
![]() Vmax [S]
Vmax [S]
Vo = ----------
![]() Km + [S]
Km + [S]
can be rearranged as follows:
| VoKm + Vo[S] = Vmax [S] | VoKm = Vmax [S] - Vo[S] | VoKm = [S] (Vmax - Vo) |
From which
![]() Vo
Vo![]() 1
1![]() Vmax
Vmax
![]() --- = - -- Vo
+ ------
--- = - -- Vo
+ ------
![]() [S]
[S]![]() Km
Km![]() Km
Km
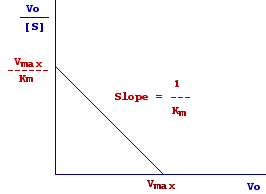
By plotting Vo/[S] versus Vo we obtain a straight line with slope 1/Km.

When
Vo/[S] = 0, Vo/Km = Vmax/Km from wich Vo = Vmax, thus the intercept on the x axis represents Vmax.
Vo = 0, Vo/[S] = Vmax/Km thus the intercept on the y axis represents Vmax/Km.
The inhibition of enzymes activity can be distinguished into irreversible and reversible inhibition.
|
E-SH + ICH2-CONH2 --------> E-S-CH2-CONH2
+ HI
|
Irreversible inhibition is due to molecules (inhibitors) which covalently bound to enzymes. As an example, iodoacetic acid can bound to some functional important SH groups, the modification (carboxymethylation) of cysteine results into an irreversible inhibition of the enzyme activity.
Reversible inhibition, on the contrary, is due to molecules which bound to the enzyme by means of weak bonds (hydrogen bonds, Van der Wals interactions, etc.). In this case, the inhibitor can be easily removed (e.g. dialysis, gel filtration, etc.) thus restoring the catalytic activity.
There are differents type of inhibition which can be distinguished by the way they alter the double reciprocal plot or another equivalent plot. These differents kinds of inhibition are illustrated below.
Competitive inhibition. The effect of a competitive inibitor on the kinetic of enzyme catalyzed reactions is illustrated in the following pictures:

As can be observed, in the plot Vo vs. [S], Vo is always lower in presence of inhibitor (blu curves) but Vmax remains unchanged. Furthermore, it should be also evident that Km increases in presence of a competitive inhibitor (remember that Km is the concentration at which Vo = Vmax/2). The same information can be obtained from the plot 1/Vo vs. 1/[S]. The intercept on the y axis (Vmax) does not change in presence of the inhibitor thus meaning that Vmax remains unchanged. On the other hand the slope of straight lines (Km/Vmax) increases as inhibitor concentrations increase thus meaning that Km increases in presence of inhibitor.
 The
effect of a competitive inhibitor (generally molecules with structures similar
to the enzyme substrate) can be explained by assuming that substrate and inhibitor
bound to the same site (i.e., they compete for the same site) forming a complex
ES and EI respectively. However while ES is transformed in E + P, the complex
EI is not transformed into E + P (or the rate of transformation is very low).
These assumption can explain the observations made above:
The
effect of a competitive inhibitor (generally molecules with structures similar
to the enzyme substrate) can be explained by assuming that substrate and inhibitor
bound to the same site (i.e., they compete for the same site) forming a complex
ES and EI respectively. However while ES is transformed in E + P, the complex
EI is not transformed into E + P (or the rate of transformation is very low).
These assumption can explain the observations made above:
1. The initial rate, in presence of the inhibitor, is lower than that in absence of inibitor. In fact, part of the enzyme is engaged with the inhibitor and thus it does not partecipate to the catalytic act (remember that the rate of the enzymatic reaction depends on [ES] which is lower in presence of the inhibitor). This also explain the increase of Km, in fact more substrate must be added to reach Vmax/2.
2. Vmax is constant. Vmax is a limit velocity which can be measured at high concentration of substrate (i.e., when all the enzyme is bound to the substrate, see above). At high concentration, the substrate is able to displace the inhibitor from the binding site and replace it. Therefore, at high concentration of substrate [ES] = initial concentration of enzyme and we observe the same Vmax as in absence of inhibitor.
By resuming, in presence of a competitive inhibitor, Vmax is constant, Km increases, Km/Vmax (the slope of the straight line which is obtained with the double reciprocal plot) increases. It should be intuitive that these differences depends on the strength the inhibitor bound to the enzyme, i.e., from the equilibrium constant of the reaction E + I = EI. In the next pages, we will derive an equation which quantitatively describe the differences observed in presence of a competitive inhibitor.