next up previous contents
Next: Conclusions and Outlook Up: 4.8 Numerical Simulations of Previous: 4.8.2 Numerical results   Contents

4.8.3 Discussion about computational cost

As far as computational effort is concerned, numerical simulations for different number of cells and different time steps have been performed beyond the previous ones, with the only purpose of performance evaluation of the code. Some indicators, such as the average number of quasi-Newton iterations per time step (NR), the average number of GMRES iterations in one quasi-Newton iteration (LIN), the simulated time $ T$, the simulation time $ T_s$ and the ratio between them, the maximum relative error $ e_{\alpha,\text{max}}=\max\vert(\hat{\alpha}^n-\alpha)/\alpha\vert$, the angle of the applied field $ \delta$, the number of cells $ N$ and the time step are reported in Table 4.1.

Table: Numerical results. Indicators of computational effort for the proposed mid-point rule numerical technique. $ \delta$ is the angle of the applied field, $ N$ is the number of cells, $ \Delta t$ is the time step, column NR reports minimum/average/maximum number of quasi-Newton iterations per time step, column LIN reports minimum/average/maximum number of GMRES iterations for one quasi-Newton iteration, $ e_{\alpha,\text{max}}=\max\vert(\hat{\alpha}^n-\alpha)/\alpha\vert$ is the maximum relative error with respect to the assigned damping parameter $ \alpha$, $ T$ is the simulated time, $ T_s$ the simulation time. $ N=1000$ refers to a prism cell of size $ 12.5\times 5\times 3$ nm. $ N=2500$ refers to a prism cell of size $ 5\times 5\times 3$ nm. $ N=6400$ refers to a prism cell of size $ 3.125\times 3.125\times 3$ nm. $ N=10000$ refers to a prism cell of size $ 2.5\times 2.5\times 3$ nm. The simulations have been performed with a Pentium 4 processor workstation (3 GHz), 1 GB RAM under RedHat Linux 9.
$ \delta$ $ N$ $ \frac{\Delta t}{\vert\gamma\vert M_s}$ [ps] NR LIN $ e_{\alpha,\text{max}}$ $ T$ [ns] $ T_s$ [s] $ T_s/T$ [s/ns]
$ 170^\circ$ 1000 2.5 11/14/17 4/5/5 $ 1.5\times 10^{-8}$ 5.7700 648.05 112
$ 170^\circ$ 2500 2.5 11/14/17 6/7/7 $ 2.0\times 10^{-7}$ 5.8450 1976.47 338
$ 170^\circ$ 6400 2.5 11/14/18 11/13/15 $ 3.0\times 10^{-7}$ 5.8400 5631.23 964
$ 170^\circ$ 10000 2.5 11/14/18 17/19/22 $ 1.3\times 10^{-7}$ 5.8425 12152.74 2080
$ 190^\circ$ 1000 2.5 11/14/17 4/5/5 $ 1.4\times 10^{-8}$ 5.5800 632.34 113
$ 190^\circ$ 2500 2.5 11/14/18 6/7/8 $ 0.7\times 10^{-7}$ 6.4100 2183.36 341
$ 190^\circ$ 6400 2.5 11/14/18 12/13/15 $ 6.2\times 10^{-7}$ 6.4100 6257.13 976
$ 190^\circ$ 10000 2.5 11/14/18 18/20/23 $ 7.0\times 10^{-7}$ 6.4100 13546.79 2113
$ 170^\circ$ 6400 1.0 9/12/14 6/6/7 $ 3.7\times 10^{-7}$ 5.8420 10145.46 1737
$ 170^\circ$ 6400 2.5 11/14/18 11/13/15 $ 3.0\times 10^{-7}$ 5.8400 5631.23 964
$ 170^\circ$ 6400 5.0 14/18/25 24/26/28 $ 3.5\times 10^{-7}$ 5.9400 4624.31 779
$ 190^\circ$ 6400 1.0 9/12/14 6/6/7 $ 1.3\times 10^{-7}$ 6.4150 11163.490 1740
$ 190^\circ$ 6400 2.5 11/14/18 12/13/15 $ 6.2\times 10^{-7}$ 6.4100 6257.13 976
$ 190^\circ$ 6400 5.0 14/18/27 23/26/30 $ 1.1\times 10^{-7}$ 7.4950 5705.520 761


In this respect, some considerations can be drawn. First, one can observe that the total number of cells $ N$ does not affect the quasi-Newton procedure in both the cases $ \delta=170^\circ$ and $ \delta=190^\circ$, whereas it affects the solution of the linear systems by increasing the average number of GMRES iterations. Second, one can clearly see that the minimum and maximum values of quasi-Newton and GMRES iterations are close to the average values, meaning that the iterative procedure weakly depends on magnetization dynamics; in fact, as seen before, the approximate jacobian matrix $ {\underline{\tilde{\textrm{J}}}}_$F depends on the particular value of magnetization vector $ \underline{\textbf{m}}$. Third, some considerations on computational cost can be made. We expect that the computational cost function $ C(N)$ of the algorithm can be reasonably expressed by the sum of two terms. In fact, at each quasi-Newton iteration the cost of the evaluation of magnetostatic field (3D FFT convolution [64]) is proportional to $ N\log N$. On the other hand, within each quasi-Newton iteration, the cost of LIN iterations of GMRES is proportional to $ N$, since basically is the cost of LIN sparse matrix-vector products. Thus, we can express the overall cost function $ C(N)$ as:

$\displaystyle C(N)=T_s(N)/T=c_1  $NR$\displaystyle  N\log N + c_2
  $NR$\displaystyle ,$LIN$\displaystyle  N \quad,$ (4.63)

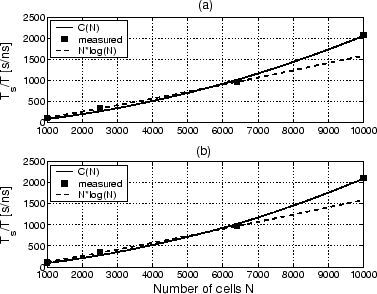
where $ c_1$ and $ c_2$ are fitting parameters. One can see from Fig. 4.10 that for moderately large number of cells, the ratio $ T_s/T$ increases according to the $ \mathcal{O}(N\log N)$ scaling expected for the computation of the demagnetizing field by the 3D FFT convolution, whereas, for larger number of cells, the computational cost of the GMRES iterations becomes prevalent. Finally, it is important to underline that by increasing the time step $ \Delta t$, the numerical algorithm exhibits a considerable speed-up, as one can see comparing the ratios $ T_s/T$ obtained in both the cases for a given number of cells $ N=6400$ and time steps such that $ (\vert\gamma\vert M_s)^{-1} 
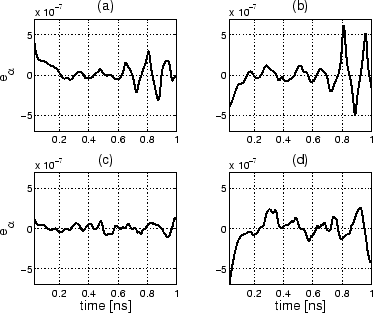
\Delta t=$1, 2.5, 5 ps. In all the simulations it has been observed that the relative error $ e_{\alpha,\text{max}}$ is in the order of $ 10^{-7}$.
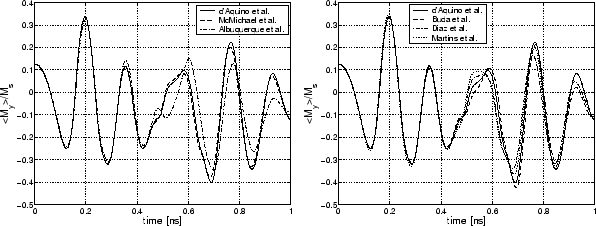
Figure: Comparison between solutions of $ \mu$-mag standard problem no. 4. Plots of $ <m_y>=<M_y>/M_s$ versus time. The external field is applied at an angle of $ 190^\circ$ off the $ x$-axis.
\begin{figure}
\begin{center}
\epsfig{figure=mumag4_190_3.125nm_time_BW2_I.eps...
...re=mumag4_190_3.125nm_time_BW2_II.eps,width=6.6cm}
\end{center}
\end{figure}
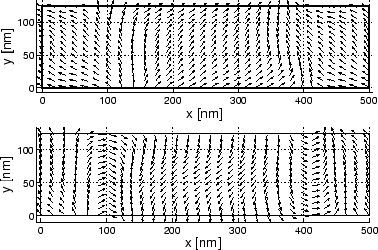
Figure: Numerical results for $ \mu$-mag standard problem no. 4. Snapshot of magnetization vector field when the average $ <m_x>$ crosses zero for the first time. The external field is applied at an angle of $ 170^\circ$ (up) and $ 190^\circ$ (down) off the $ x$-axis.
\begin{figure}
\begin{center}
\epsfig{figure=mumag4_170_3.125nm_vector_BW.eps,...
...gure=mumag4_190_3.125nm_vector_BW.eps,width=8.5cm}
\end{center}
\end{figure}
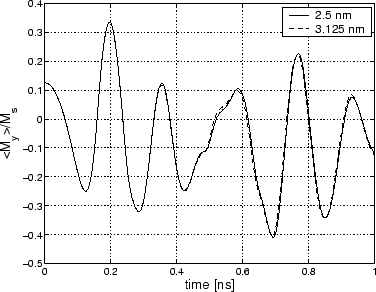
Figure: Numerical results for $ \mu$-mag standard problem no. 4. Plots of $ <m_y>=<M_y>/M_s$ versus time for two different sizes of the mesh edge length. The external field is applied at an angle of $ 190^\circ$ off the $ x$-axis.
\begin{figure}
\begin{center}
\epsfig{figure=mumag4_mesh_comp2.eps,width=8.5cm}
\end{center}
\end{figure}
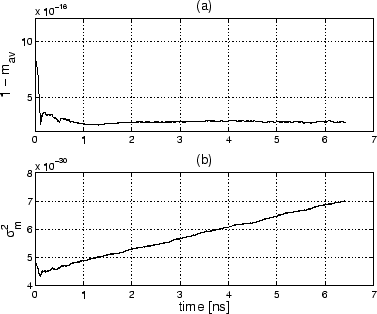
Figure: Numerical results for $ \mu$-mag standard problem no. 4. (a) Plot of $ 1-$m$ _$av as a function of time. (b) Plot of the variance $ \sigma _$m$ ^2$ as a function of time. In both plots $ \delta=190^\circ$, $ N=6400$.
\begin{figure}
\begin{center}
\epsfig{figure=stat_plot2.eps,width=8.5cm}
\end{center}
\end{figure}
Figure: Numerical results for $ \mu$-mag standard problem no. 4. Plot of the relative error $ e^n_\alpha=(\hat{\alpha}^n-\alpha)/\alpha$ as a function of time. (a) $ \delta=170^\circ$, $ N=6400$. (b) $ \delta=170^\circ$, $ N=10000$. (c) $ \delta=190^\circ$, $ N=6400$. (d) $ \delta=190^\circ$, $ N=10000$.
\begin{figure}
\begin{center}
\epsfig{figure=alpha_dyn_plot2.eps,width=8.5cm}
\end{center}
\end{figure}

\begin{figure}
\begin{center}
\epsfig{figure=time_evolution.eps,width=8.5cm}
\end{center}
\end{figure}
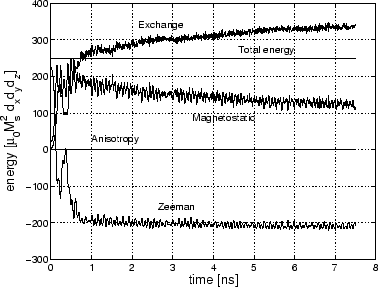
Figure: Numerical results for $ \mu$-mag standard problem no. 4 in the conservative case $ \alpha=0$. Plot of exchange, anisotropy, magnetostatic, Zeeman and total free energy as functions of time. $ \delta=190^\circ$, $ N=6400$.
\begin{figure}
\begin{center}
\epsfig{figure=energy_plot.eps,width=8.5cm}
\end{center}
\end{figure}
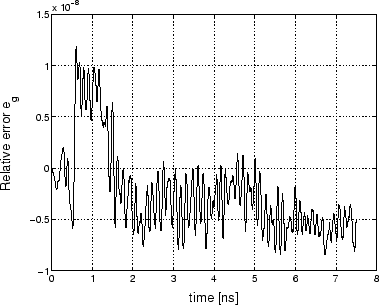
Figure: Numerical results for $ \mu$-mag standard problem no. 4 in the conservative case $ \alpha=0$. Plot of the relative error $ e_$g$ ^n=(\underline{{\text{g}}}(\underline{\textbf{m}}^0;\underline{\textbf{h}}_a)-...
...}_a))/\underline{{\text{g}}}(\underline{\textbf{m}}^0;\underline{\textbf{h}}_a)$ as function of time. $ \delta=190^\circ$, $ N=6400$.
\begin{figure}
\begin{center}
\epsfig{figure=rel_error_g.eps,width=8.5cm}
\end{center}
\end{figure}
Figure: Numerical results for $ \mu$-mag standard problem no. 4. Plots of the ratio $ T_s/T$ between simulation time $ T_s$ [s] and simulated time $ T$ [ns] for different number of cells $ N$. The theoretical computational cost function $ C(N)$ and $ N\log N$ scaling are also reported. The time step is such that $ (\vert\gamma\vert M_s)^{-1} \Delta t=2.5$ ps. (a) $ \delta=170^\circ$; $ c_1=5\times 10^{-4}$, $ c_2=5.2\times 10^{-4}$ (b) $ \delta=190^\circ$; $ c_1=6\times
10^{-4}$, $ c_2=4.8\times 10^{-4}$
\begin{figure}
\begin{center}
\epsfig{figure=scaling_plot4.eps,width=8.5cm}
\end{center}
\end{figure}

next up previous contents
Next: Conclusions and Outlook Up: 4.8 Numerical Simulations of Previous: 4.8.2 Numerical results   Contents
Massimiliano d'Aquino 2005-11-26