NEW! Since end of July 2020 the mathematical model is able to monitor multiple waves of coronavirus spreading (both for World Countries and Italian Regions)

| Quantity | Description |
|---|---|
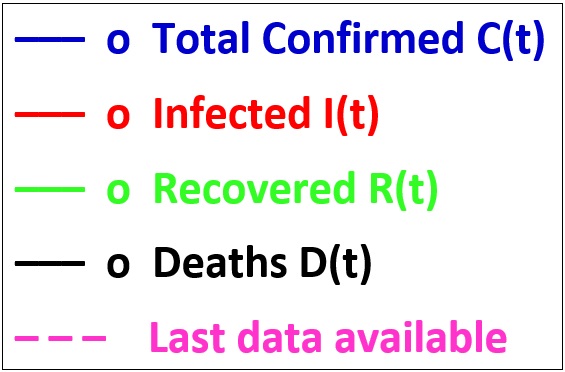
C, I, R, D, HO, IC |
respectively: confirmed cases, infected, recovered, deaths, hospitalized with symptoms, hospitalized in intensive care. |
Cmax |
expected maximum number of infected people at the saturation of contagions t > tsat_C. |
tsat_C |
expected day of contagion saturation when C(tsat_C) = 99% Cmax. |
tmax_C |
expected day of maximum growth rate (maximum number of positive cases per day). |
dC |
last daily change (difference with respect to the day before) of total positive. |
dC7 |
number of confirmed cases over the last 7 days. |
i7_100k |
number of confirmed cases over the last 7 days per 100000 inhabitants (pop = total population). |
dCmax |
expected maximum daily change for total positive at time t = tmax_C. |
Rmax |
expected maximum number of recovered people at the saturation time t > tsat_R. |
tsat_R |
expected day of recovered saturation when R(tsat_R) = 99% Rmax. |
tmax_R |
expected day of maximum growth rate (maximum number of recovered per day). |
dR |
last daily change (difference with respect to the day before) of recovered people. |
dRmax |
expected maximum daily change for recovered people at time t = tmax_R. |
Dmax |
expected maximum number of deceased people at the saturation time t > tsat_D. |
tsat_D |
expected day of deaths saturation when D(tsat_D) = 99% Dmax. |
tmax_D |
expected day of maximum growth rate (maximum number of deaths per day). |
dD |
last daily change (difference with respect to the day before) of deceased people. |
dDmax |
expected maximum daily change for deceased people at time t = tmax_D. |
Imax |
maximum number of active cases (positive people) at day tmax_I. |
tmax_I |
expected day of maximum active cases (positive people) people per day. |
tzero_I |
expected day of positive cases when 99% of recovered is reached (t > tsat_R), almost zero active cases. |
dI |
last daily change (difference with respect to the day before) of active cases (positive people). |
dImax |
expected maximum daily change for active cases (positive people) at time t = tmax_I. |
DT1w_C, DT1w_I, DT1w_R, DT1w_D |
doubling time (days) for C, I, R, D, HO, IC computed over last 7 days. |
DT2w_C, DT2w_I, DT2w_R, DT2w_D |
doubling time (days) for C, I, R, D, HO, IC computed over last 14 days. |
DT1m_C, DT1m_I, DT1m_R, DT1m_D |
doubling time (days) for C, I, R, D, HO, IC computed over last 30 days. |