We consider, as a measure of the switching speed, the time instant
at which the average component ( means
spatial average) is zero after the application of the external
field (the external field strength is the same in both the
simulations):
(3.22)
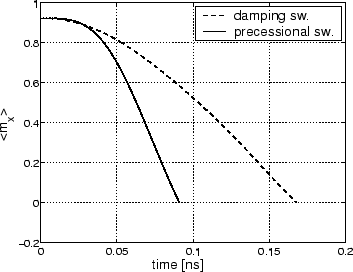
Figure:
Numerical results. Comparison between damping (dashed
line) and precessional (solid line) switching: time for average
component to reach zero from the starting configuration for
kA/m.
In figure 3.5 one can observe the behavior of
the average component until it reaches zero, showing that
the precessional switching dynamics is much faster
(
ns) than damping switching's (
ns). This is due to the different nature of the mechanism
driving magnetization motion in the two processes: in conventional
switching there is only one equilibrium configuration after the
application of the external field, namely the reversed state, so
the switching process is a kind of relaxation process towards the
equilibrium and therefore the damping process is crucial.
Conversely, in precessional switching the main role is played by
the magnetic torque acting on the magnetization, which causes a
fast precessional motion around the effective field driving the
magnetization back and forth between the initial and the reversed
state. Therefore, in most cases this process is so fast that
dissipative effects can be neglected.
Next:3.2.2 Spatial Magnetization uniformity Up:3.2 Comparison between Damping Previous:3.2 Comparison between DampingContents
Massimiliano d'Aquino
2005-11-26